Performing linecuts using the Scissors class
Importing the Scissors class
from nxs_analysis_tools import Scissors, load_transform
from nxs_analysis_tools.datasets import cubic

sample_directory = cubic() # Download the example data into cache directory

from nexusformat.nexus import NXdata, NXfield
import numpy as np
Setting up a linecut - Method 1
You can set the data, linecut center, integration window, and integration axis when you initialize the Scissors object.
data = load_transform(f'{sample_directory}/cubic_15.nxs')
data:NXdata
  @axes = ['Qh', 'Qk', 'Ql']
  @signal = 'counts'
  Qh = float64(100)
  Qk = float64(150)
  Ql = float64(200)
  counts = float64(100x150x200)
scissors = Scissors(data, center=(0,0,0), window=(0.75,0.2,0.15), axis=None)
Setting up a linecut - Method 2
…or you can set them one by one after initializing the object.
scissors = Scissors()
scissors.set_data(data)
scissors.set_center((0,0,0))
scissors.set_window((0.75,0.2,0.15))
Performing a linecut
You can use .cut_data() to perform the cut, returning an NXdata object.
linecut = scissors.cut_data()
Plotting a linecut
The .integration_window attribute stores a tuple of slice objects over which the integration was performed.
scissors.integration_window
(slice(np.float64(-0.75), np.float64(0.75), None),
 slice(np.float64(-0.2), np.float64(0.2), None),
 slice(np.float64(-0.15), np.float64(0.15), None))
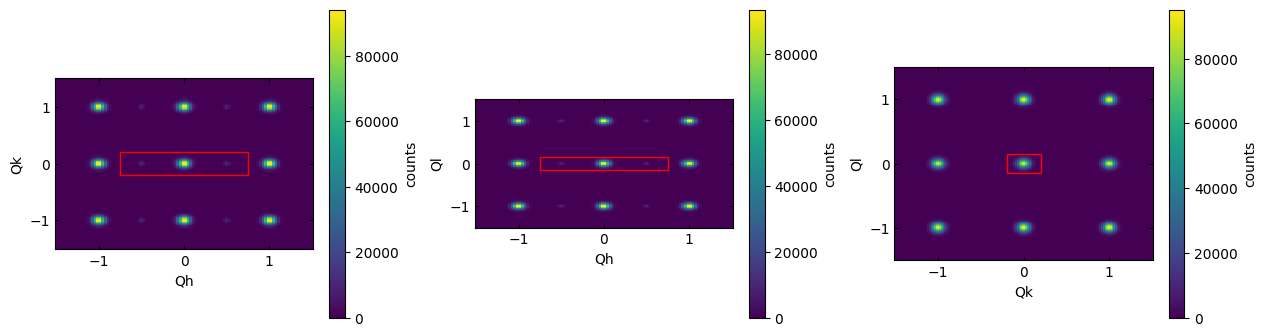
To show where the integration was performed, use the .plot_integration_window() method.
scissors.plot_integration_window()
(<matplotlib.collections.QuadMesh at 0x74e663abecb0>,
 <matplotlib.collections.QuadMesh at 0x74e663b62260>,
 <matplotlib.collections.QuadMesh at 0x74e66194e7d0>)
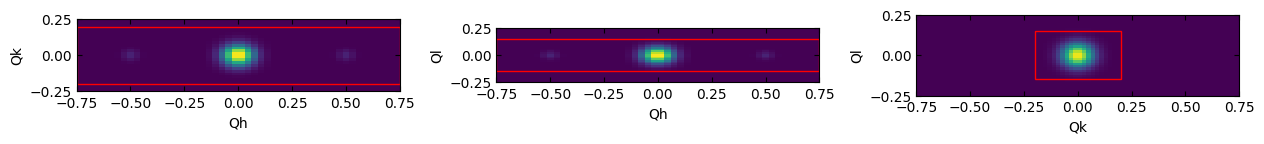
Use the optional width and height parameters to zoom in on the region of interest.
scissors.plot_integration_window(width=1.5, height=0.5, cbar=False)
(<matplotlib.collections.QuadMesh at 0x74e6955343a0>,
 <matplotlib.collections.QuadMesh at 0x74e661784a30>,
 <matplotlib.collections.QuadMesh at 0x74e6617a3a00>)
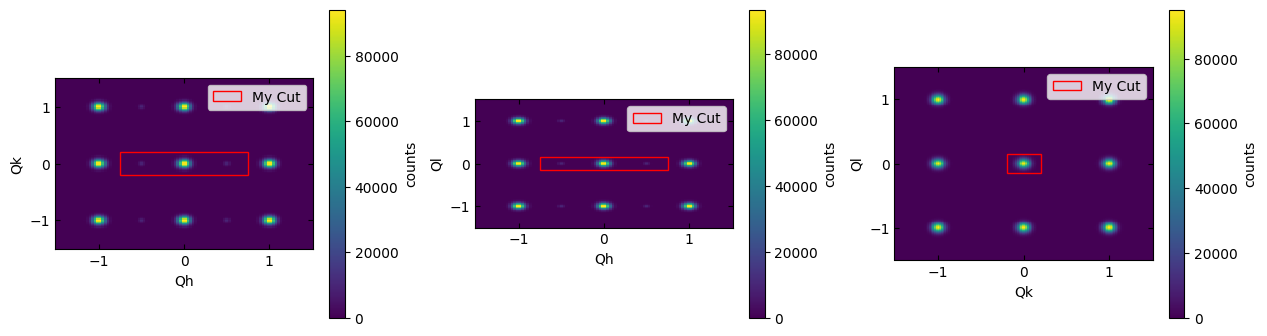
The label parameter allows you to specify a label for the highlighted region.
scissors.plot_integration_window(label='My Cut')
(<matplotlib.collections.QuadMesh at 0x74e661772a40>,
 <matplotlib.collections.QuadMesh at 0x74e661514550>,
 <matplotlib.collections.QuadMesh at 0x74e661579ed0>)
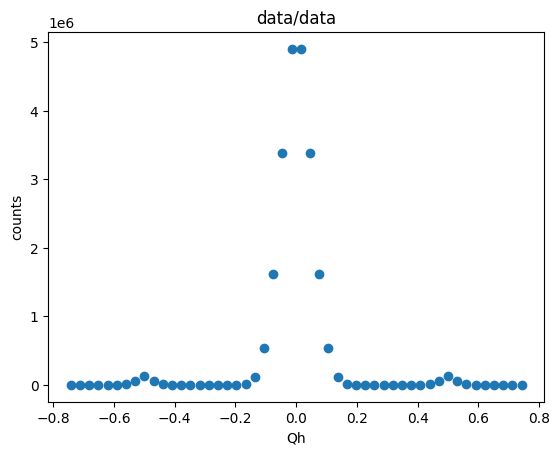
The .plot() method of the NXdata object can be used to generate a basic plot of the linecut.
linecut.plot()